
 Pablo tore
Key Takeaways
- The U.S. remains the world’s largest crude oil producer in 2026.
- Production reached nearly 13.7–13.8 million barrels per day (bpd) in early 2026.
- The shale revolution transformed U.S. oil production after 2008.
- Texas and the Permian Basin drive most recent production growth.
- Future growth is expected to slow, but production remains near record highs.
The United States oil industry has changed dramatically over the last 50 years. From conventional oil dominance in the 1970s to the shale boom of the 2010s, U.S. oil production has seen major highs and lows.
Understanding historical oil production helps investors, analysts, and energy businesses evaluate market cycles, supply trends, and future opportunities.
US Oil Production by Year (Historical Data)
The table below shows major milestones in U.S. crude oil production history.
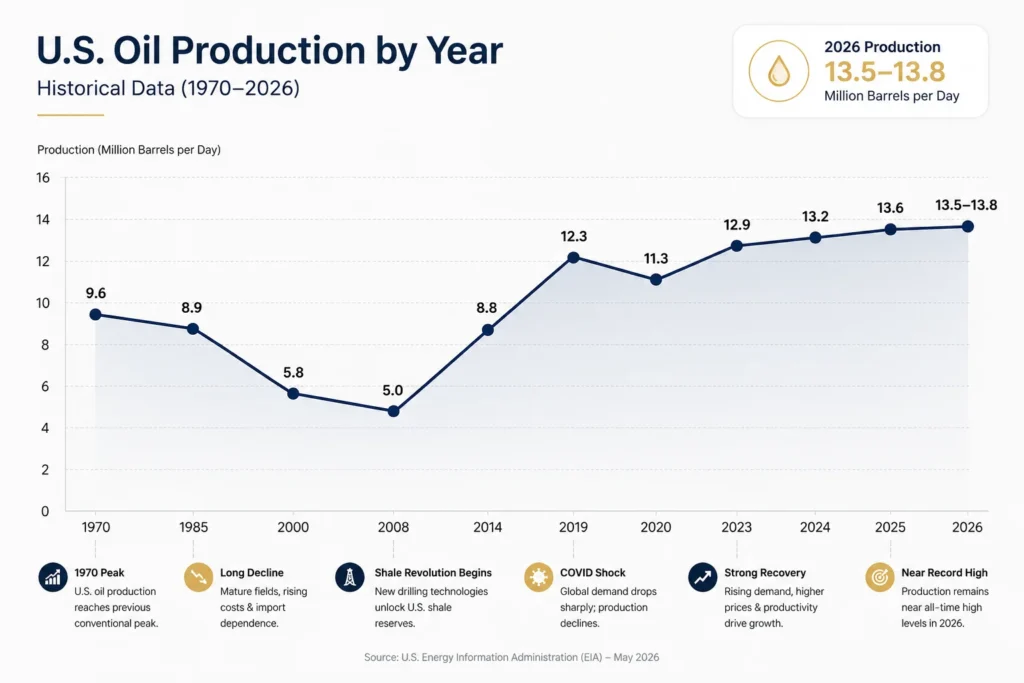
| Year | Production (Million Barrels/Day) | Market Context |
|---|---|---|
| 1970 | 9.6 | Previous conventional oil peak |
| 1985 | 8.9 | Decline after 1970 peak |
| 2000 | 5.8 | Rising import dependence |
| 2008 | 5.0 | Near historic low before shale boom |
| 2014 | 8.8 | Shale production surges |
| 2019 | 12.3 | Pre-pandemic record |
| 2020 | 11.3 | COVID demand collapse |
| 2023 | 12.9 | Strong recovery |
| 2024 | 13.2 | New record high |
| 2025 | 13.6 | Continued shale growth |
| 2026 | 13.5–13.8 | Near all-time high |
Data sourced from the U.S. Energy Information Administration (EIA). (U.S. Energy Information Administration)
1970–2008: The Long Decline
U.S. oil production peaked in 1970 at around 9.6 million bpd. After that, output declined for decades.
Main reasons:
- Mature oil fields depleted
- Rising extraction costs
- Increased foreign oil imports
- Limited drilling efficiency
By 2008, production fell to nearly 5 million bpd, the lowest level in decades. During this period, America became heavily dependent on imported crude.
Quick Fact
At one point, the U.S. imported more than half of the oil it consumed.
2008–2019: The Shale Revolution
Everything changed after 2008.
New technologies transformed production:
- Horizontal drilling
- Hydraulic fracturing
- Advanced seismic imaging
These innovations unlocked shale reserves previously considered uneconomical.
Major shale regions included:
- Permian Basin
- Eagle Ford
- Bakken
- Delaware Basin
Production more than doubled between 2008 and 2019. The U.S. became the world’s largest oil producer.
2020: COVID Shock
The pandemic caused one of the biggest disruptions in oil market history.
Global lockdowns reduced:
- Air travel
- Fuel demand
- Industrial activity
Oil demand collapsed, forcing producers to shut wells.
Production dropped from 12.3 million bpd in 2019 to around 11.3 million bpd in 2020.
Many operators cut capital spending and delayed drilling projects.
2021–2024: Recovery Phase
As economies reopened, oil demand recovered.
Higher prices encouraged drilling activity again.
Recovery drivers:
- Strong fuel demand
- LNG exports
- Industrial growth
- Better well productivity
By 2024, U.S. production hit a new record of 13.2 million bpd. The biggest growth came from the Permian Basin in Texas and New Mexico.
US Oil Production in 2026
In 2026, U.S. crude production remains extremely strong.
Recent EIA monthly data shows production near 13.7–13.8 million bpd. (U.S. Energy Information Administration)
Major producing states include:
- Texas
- New Mexico
- North Dakota
- Alaska


Why Production Is Still High
Several factors support output in 2026:
- Improved drilling efficiency
- Longer horizontal wells
- AI-driven field analytics
- Strong export demand
Even with fewer active rigs, operators are producing more per well.
What Drives Production Growth?
Oil production depends on several market forces.
1. Oil Prices
Higher oil prices usually encourage more drilling.
When prices rise:
- Companies invest more
- New wells become profitable
- Production expands
2. Technology
Technology continues improving recovery rates.
Examples:
- AI reservoir modeling
- Predictive maintenance
- Automation
3. Basin Quality
Not all basins produce equally.
The Permian Basin remains the most productive U.S. oil region due to low breakeven costs and strong infrastructure.
Future Outlook
Production growth is expected to slow slightly after years of rapid expansion.
The EIA expects average U.S. crude output around 13.5 million bpd in 2026, with only modest growth ahead. (U.S. Energy Information Administration)
Challenges include:
- Price volatility
- Regulation
- Labor costs
- Capital discipline
Still, the U.S. remains a global energy leader.
Final Thoughts
U.S. oil production tells a powerful story of decline, innovation, and recovery. After falling from its 1970 peak to a low in 2008, the shale revolution completely reshaped the industry. In 2026, production remains near record highs, driven largely by Texas and the Permian Basin. While future growth may slow, the U.S. oil sector remains central to global energy markets.

GIPHY App Key not set. Please check settings